
Last month, I told you how the Microsoft Office suite can help you with your writing. I covered Microsoft Word, and how it’s more powerful than just a standard word processor. By getting to know some of the more obscure features of these (usually) easily obtainable and available programs, writers can take control of their writing without having to purchase expensive computer programs.
With Microsoft Word, I covered how Section Breaks, Styles, and Formatting can help a writer create a professional-looking book with less effort. Even though our next program isn’t used directly for the actual writing of a book, it is incredibly valuable for planning and prepping. It can also be used during the polishing phase of a manuscript as well. I refer, of course, to:
MICROSOFT EXCEL
As an engineer, I love to use spreadsheets, and Excel is the king of the spreadsheet programs. Any time I need to write a list or do some calculations, I open up a new Excel spreadsheet and get to work. Just like Microsoft Word, Excel has plenty of capability most people never use. The following three tools in Microsoft Excel are only a few of the numerous features of this powerful program . . .
- Filter: In the lead-up to writing a book, I usually have plenty of lists to help me organize my thoughts. While Microsoft Word can work for simple bullet lists, there are often cases where the complexity of the data is more extensive than just a series of names, places, or plot points. Take my 2013 NaNoWriMo project, which was the first book in The Constellation Tournament trilogy. I had 88 distinct characters in this series, and each one had slightly different attributes that I needed to be able to group based on a variety of factors. By using the “Filter” function under the “Data” tab, I was able to sort these characters based on gender, size, and abilities. Being able to filter my huge list of characters made it easy for me to recall each of their attributes as part of a larger group. When it was time to write the book, I could simply and easily bring up the information I needed because I could sort based on these different attributes. To use the Filter function (which is also available on the “Home” tab under the “Editing” section), just select the top row of your spreadsheet (where your labeled categories should be), and click the little funnel icon that says “Filter.” This gives the top row a series of drop-down menus that you can use to sort, filter, and organize your data any way you want.

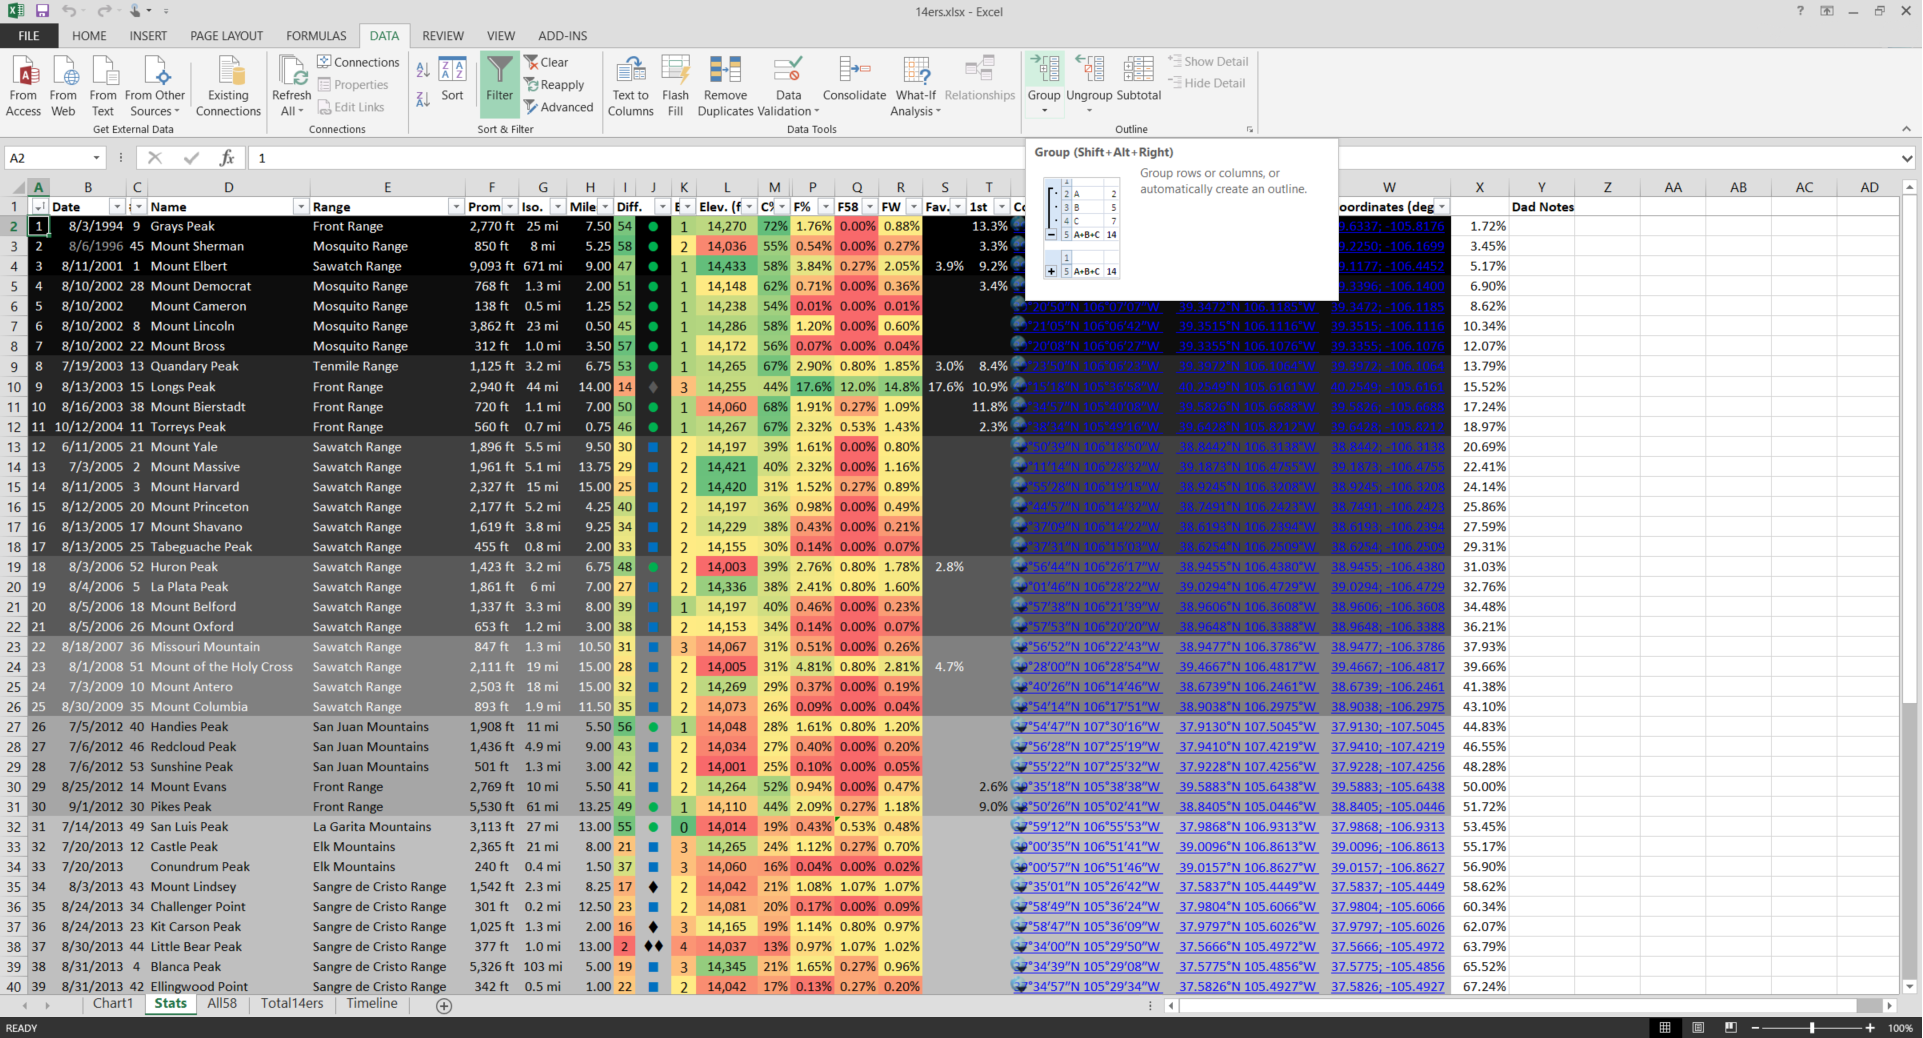
- Data Grouping: Under the same “Data” tab where you’ll find the “Filter” function, there’s a section called “Outline.” For any writer who has planned out their work, an outline is an essential function of that preparation. Again, you could use Microsoft Word and create a bullet list that highlights the critical plot points, or you could put the same list of plot points in Excel and be able to expand and collapse whole chapters at will. By using Data Grouping, you can essentially put as much or as little detail into your outline as you want, while efficiently controlling what level of detail you want to see. What’s nice about this is how you can create timelines for your plot and perceive at a glance when specific events happen in the story. Because Excel is still a computational tool, you can use the formulas inherent within it to calculate the timeline of your book. For example, let’s say a particular event takes a week to occur, but there are a series of smaller tasks that lead up to this event. If you put in the amount of time each of the smaller tasks will take for each section of the plot, then add them together at the main bullets, you can then see how much time passes for the larger parts of the book by collapsing the plot points that you’ve created using Data Grouping. In this way, you can see gaps in your timeline. Similarly, if you’re listing out dates and times that events occur for parallel storylines, you can use the Filter function to sort them chronologically before dividing them into your sections and chapters via Data Grouping. There’s plenty of potential applications for this feature if you spend some time and learn how to use it.
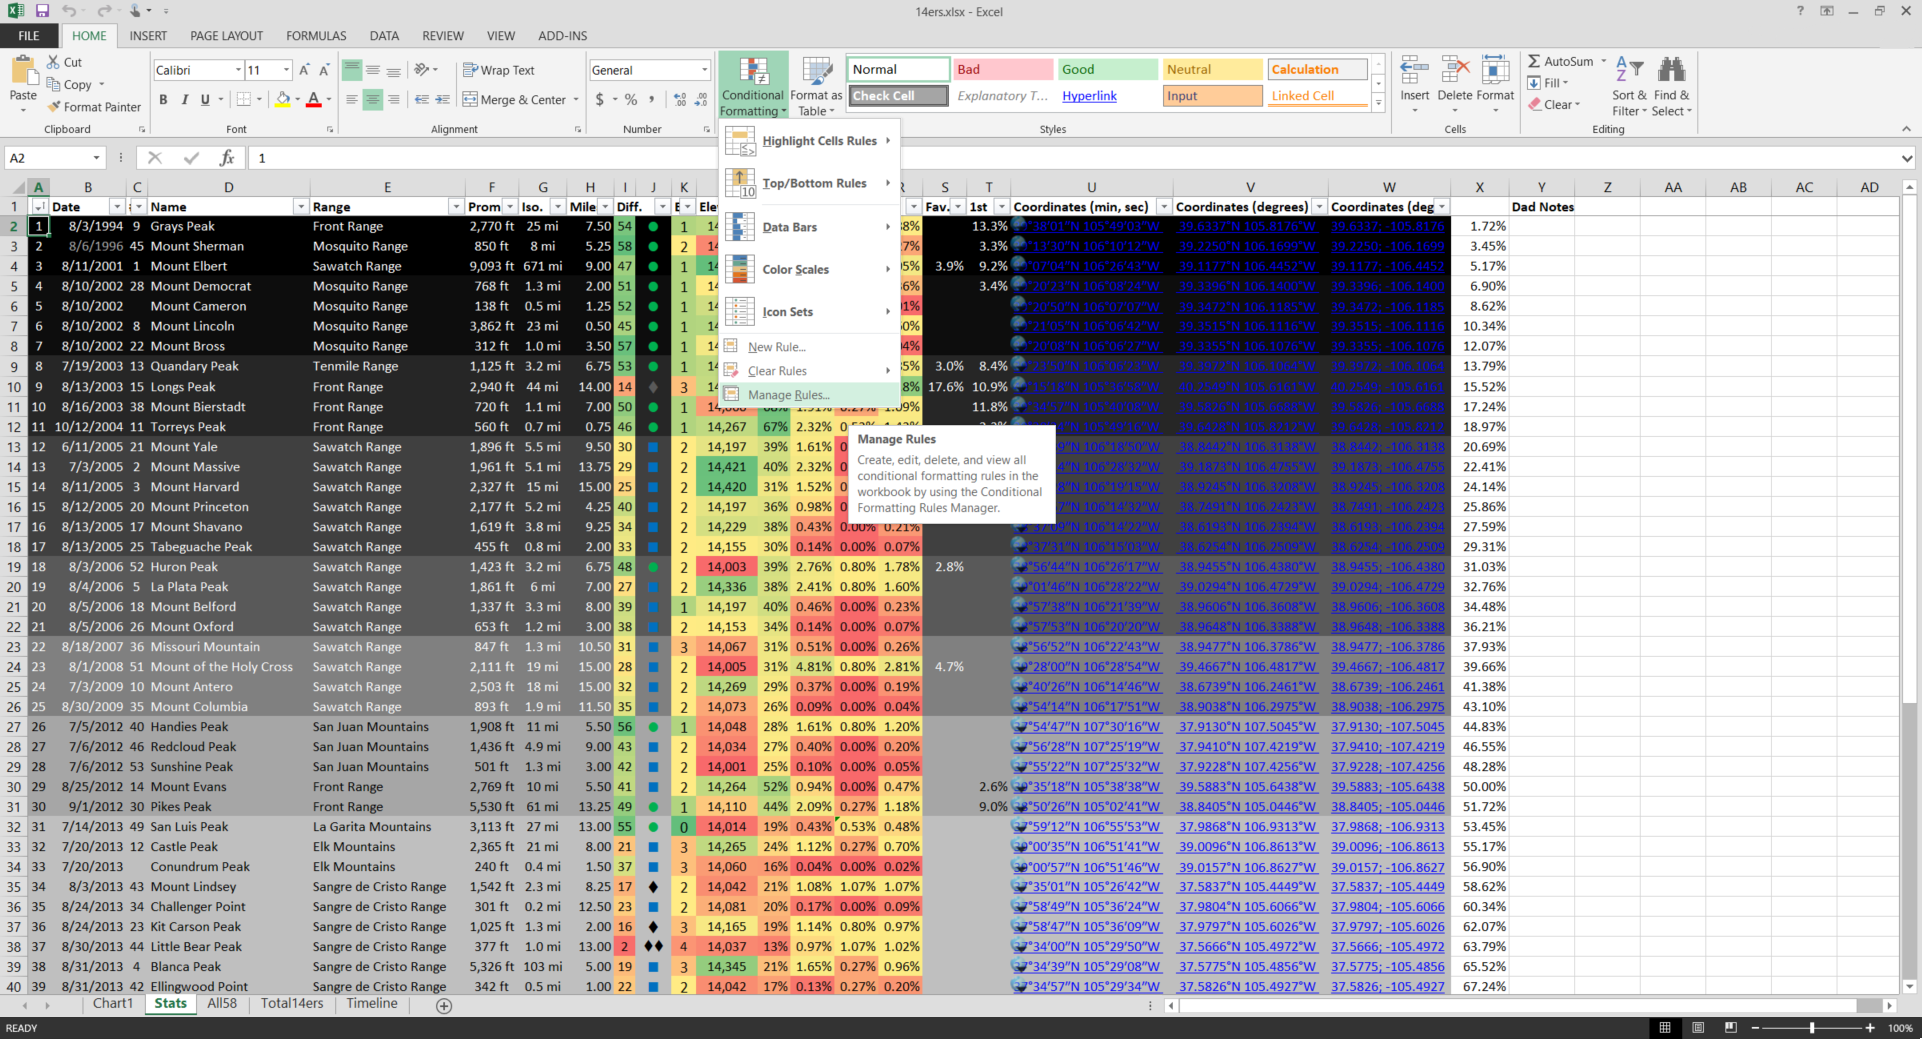
- Conditional Formatting: A huge table of data can be intimidating to digest at a glance. Sometimes we get lost in the numbers and values of the spreadsheet and don’t know what to look for. Conditional Formatting helps to curb this problem by applying visual cues to a spreadsheet. Underneath the “Styles” section of the “Home” tab, there’s a drop-down for Conditional Formatting that gives you some options. Do you want to know which of your characters are the tallest or shortest? Apply a Top/Bottom Rule to the column that contains the characters’ heights. Does a key event happen at a particular time in the story? Highlight anything that occurs before it as “Green” and anything that happens after as “Red” to remind yourself what the mood of the characters should be. Is there a particular attribute that you want to be sorted in a specific way? Add a Color Scale to show the difference between the values when the table is sorted in different ways. Basically, Conditional Formatting helps to automatically add color to your spreadsheet, thus making it easier for you to read and find the information you need.
While these three tools are quite powerful, the capabilities of Microsoft Excel extend well beyond them. I haven’t even covered Charts, Formulas, or Text to Columns, each of which can help a writer plan out their work, as well as help them ensure they can identify their plot holes before they write them into the story. Just be careful to not spend so much time in the planning phase going down Excel’s numerous rabbit holes. You’ll still have to open up Microsoft Word to write the story after all.
Next month, we’ll discuss how Microsoft PowerPoint is a cheap alternative to Photoshop and how it can help you organize the scenes of your plot.